
In November 2024 the Ohio State Auditor’s office released the special report, “Longitudinal School Finance Study”. This report provided an analysis of spending, revenue and enrollment in Ohio public schools from FY2000 through FY2022. The report also included a brief analysis of math and reading scores from the National Assessment for Educational Progress (NAEP) from 2000 to 2022. This memo provides a review and summary of the Auditor’s report’s main findings along with some additional information provided by OEPI required to place these findings in their proper context. All figures shown in Tables 1-4 of this memo are either taken directly from the Auditor’s report or calculated by OEPI based on the information presented in the Auditor’s report.
When layering those considerations, the Auditor’s report found that public school spending has increased during the time period assessed. Spending did roughly double during the first half of the study’s timeframe (FY00-FY10), coinciding with the years that state policymakers were making concerted efforts to increase K-12 education funding the aftermath of the Ohio Supreme Court’s DeRolph ruling. Overall, total revenues and expenditures, both in total and on a per pupil basis, have increased by less than 1% annually beyond inflation from FY2000 to FY2022. During that time, U.S. Census Data shows a 9.2% decline in Ohio’s population of school aged children and Ohio Department of Education and Workforce (DEW) data showcases a significant increase in both the number and percentage of higher cost pupils including students with disabilities, economically disadvantaged pupils, and English learners — resulting in higher expenditures per pupil. Over the 22-year timeframe of this study, it is also important to note Ohio fell from 35th to 45th among the 50 states in U.S. Census Data ratings of the percentage of public school operating revenue coming from state sources. Further elaboration on these key findings are outlined in the following pages.
I. Overview of Report Methodology
The report itself is written in a factual, objective manner. The report appropriately focuses on operating expenditures and revenues and excludes capital expenditures and revenue, and also spending related to non-school age programs such as adult education.
The National Center for Educational Statistics (NCES) is the source of the expenditure and revenue data used in the Auditor’s analysis. This is a widely used and readily available source of primary and secondary school financial data. DEW provides this data to NCES annually. FY22 is the most current for which data is available through NCES.
The NCES data is similar but not identical to that found in the DEW Ohio District Profile Report (more commonly known as the “Cupp Report”). The Cupp Report per pupil expenditure, local revenue, state revenue and federal revenue data is all lower than that found on the NCES website. The Auditor’s report refers to “total Ohio public school spending” because the NCES data includes community school and JVSD data as well as that of the 609 traditional K-12 school districts. In any event, the NCES data used in the Auditor’s analysis is consistent over time which is a fundamentally important consideration when conducting a longitudinal analysis.
It is also worth noting that the NCES state revenue data in the middle years of the time frame incorrectly includes state funding for community schools and the voucher programs which used the old “deduction” method of funding (this issue was discovered by Howard Fleeter in 2018 and reported to NCES and the U.S. Census Bureau). However, the Auditor’s analysis focuses almost entirely on comparing the endpoints of the timeframe (FY00 and FY22). FY22 was the first year where the deduction method of funding was eliminated and in FY00 both community schools and vouchers were in their infancy, so this is likely not a significant issue. Also, this issue does not apply to the expenditure data which has never included voucher funding.
The Auditor’s report appropriately adjusts for inflation when analyzing the expenditure and revenue data over time. The report adjusts for inflation by using the U.S. Bureau of Labor Statistics Consumer Price Index for All Urban Consumers, commonly known as the CPI-U. This is the most widely known measure of inflation, and it is readily available to anyone online. When measuring inflation from one year to another you can choose to compare the CPI at (1) the end of each year, (2) in the middle of each year, or (3) over the course of the entirety of each of the two years in question. All of these approaches are equally valid. The Auditor’s analysis chose to use the endpoints of each year in order to compute inflation over the timeframe (this means that they measure inflation from June 2000 to June 2022). This method produced an inflation rate of 71.9%. This is higher than the inflation rates found when using either the midpoint of the fiscal year (January to January) or by comparing the yearly average inflation in the FY00 to the year average inflation in FY22. By using the higher inflation rate the Auditor’s analysis provides a conservative measure of the inflation-adjusted growth over time in Ohio public school revenues and expenditures. (Note that an inflation rate of 71.9% means that it requires $171.87 in June 2022 to have the same buying power as $100 did in June 2000.)
Finally, the Auditor’s analysis provided calculations which made an adjustment for COVID-19 funding in the aftermath of the pandemic. These calculations are explained in the text of the report and also in the footnotes to the tables shown in the report’s Appendix on pages 12 and 13. Given the once-in-a-hundred-years uniqueness of the COVID pandemic isolating this funding is a completely appropriate step to take. This review of the Auditor’s report will show the findings in summary tables which will both include and exclude the COVID-19 funding and spending.
II. Report Findings: Total Expenditures and Revenues
The Auditor’s analysis examines Ohio public school revenues and expenditures on a total dollar and per pupil basis. Table 1 provides a summary of the report’s findings in total dollars. The table shows total revenues and expenditures in the initial year of the study (FY2000) and in the end year (FY2022). Revenue growth is shown in “nominal” dollars which are not adjusted for inflation as well as in “real” dollars (which are adjusted for inflation).
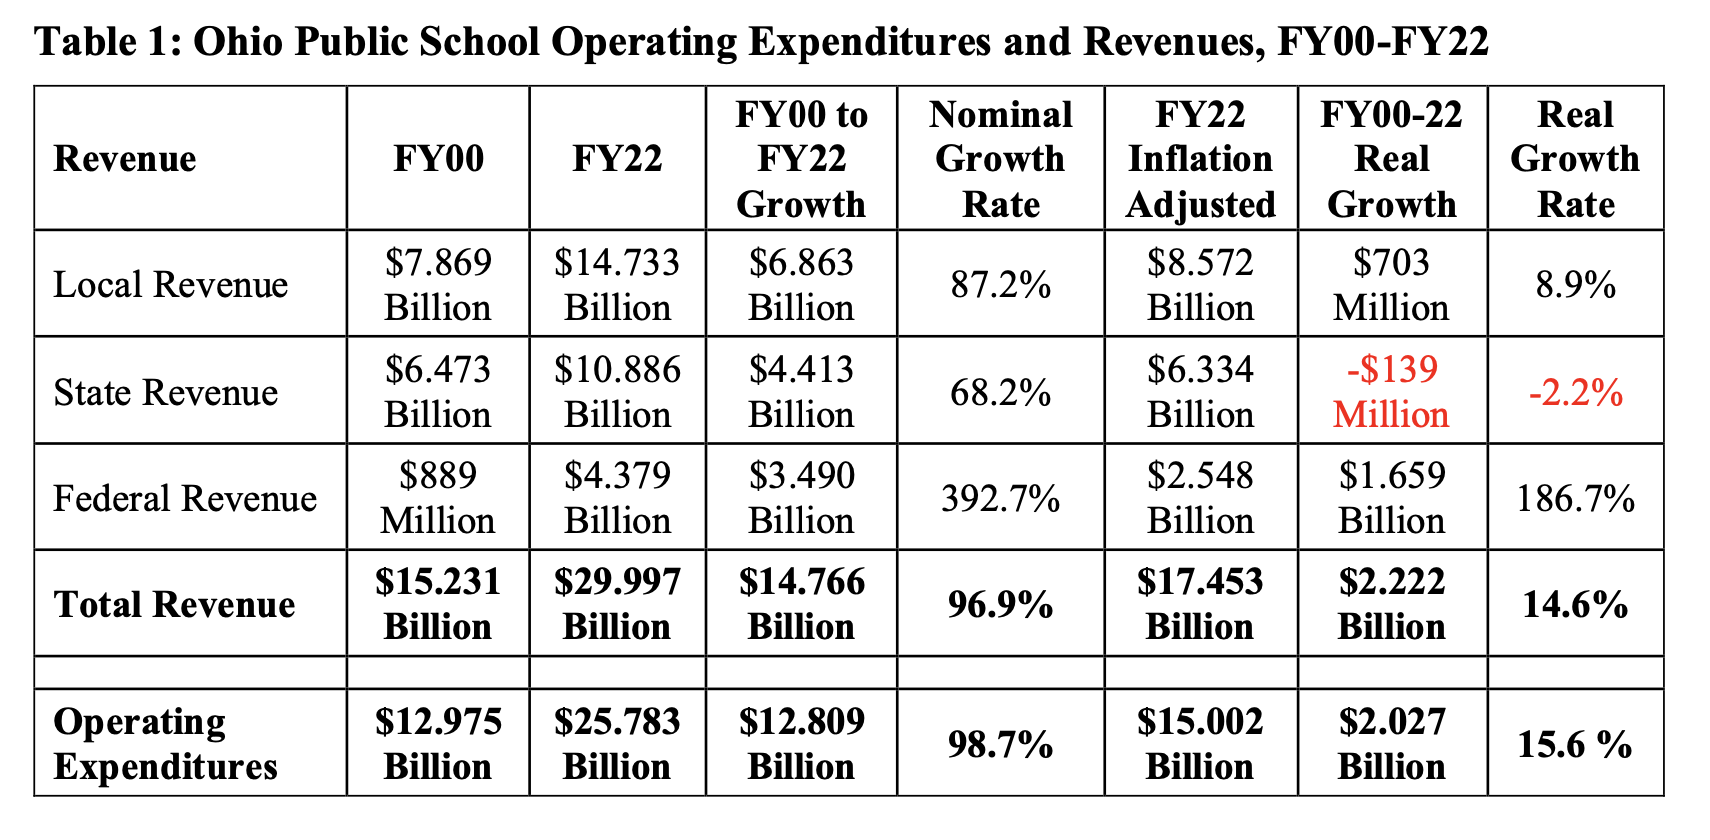
Table 1 shows that total revenues increased from $15.231 billion in FY00 to $29.997 billion in FY22, an increase of $14.766 billion (unadjusted for inflation). In percentage terms this is an increase of 96.9%, nearly double. Table 1 also shows that adjusting for inflation, FY22 revenues were $17.453 billion in FY00 “real” dollars. This is an inflation adjusted increase of $2.222 billion and a growth rate of 14.6%. Over 22 years this is average annual inflation adjusted revenue growth of 0.66% (less than 1%).
Table 1 also shows that local revenues increased from $7.869 billion in FY00 to $14.733 billion in FY22. This is an increase of $6.863 billion (87.2%), unadjusted for inflation. Adjusting for inflation, FY22 local revenues were $8.572 billion in FY00 “real” dollars. This is an inflation adjusted increase of $703 million and a growth rate of 8.9%. Over 22 years this is average annual inflation adjusted revenue growth of 0.40% (less than ½ of 1%).
In addition, Table 1 shows that state revenues increased from $6.473 billion in FY00 to $10.886 billion in FY22. This is an increase of $4.413 billion (68.2%.) unadjusted for inflation.
Adjusting for inflation, FY22 state revenues were $6.334 billion in FY00 “real” dollars. This is an inflation adjusted decrease of -$139 million and a growth rate of -2.2%. Over 22 years this is average annual inflation adjusted revenue growth of -0.10% (negative 1/10th of 1%).
Finally, Table 1 shows that Federal revenues increased from $889 million in FY00 to $4.379 billion in FY22. This is an increase of $3.490 billion (392.7%), unadjusted for inflation. Adjusting for inflation, FY22 Federal revenues were $2.548 billion in FY00 “real” dollars. This is an inflation adjusted increase of $1.659 billion and a growth rate of 186.7%.
Table 1 shows that total operating expendituresincreased from $12.975 billion in FY00 to $25.783 billion in FY22. This is an increase of $12.809 billion (98.7%), unadjusted for inflation.
Adjusting for inflation, FY22 expenditures were $15.002 billion in FY00 “real” dollars. This is an inflation adjusted increase of $2.027 billion and a growth rate of 15.6%. Over 22 years this is average annual inflation adjusted revenue growth of 0.71% (less than 1%).
Adjusting for Short-term COVID-19 Federal Funding and Spending
Table 2 on the following page provides a summary of the Auditor’s report’s findings excluding COVID-19 revenues and expenditures. Table 2 is organized in the same manner as Table 1 above, and the data in the rows highlighted in yellow in Table 2 is referred to in the text of the Auditor’s report and explained in the footnote to the Table on page 13 of the Auditor’s report but is not explicitly shown (note that some figures were computed by OEPI based on the data provided).
Table 2 shows that excluding $1.952 billion in COVID funding reduces FY22 Federal revenue from $4.379 billion shown in Table 1 to the $2.427 billion shown in Table 2. This means that Federal revenue increased by $1.539 billion (173.1%) from FY00 to FY22 rather than by the $3.490 billion (392.7%) shown in Table 1. (All figures unadjusted for inflation).
In terms of total revenues, Table 2 shows that the exclusion of the COVID aid results in an increase from $15.231 billion in FY00 to $28.046 billion in FY22, unadjusted for inflation. This is an increase of 84.1%, nearly 13 percentage points lower than the 98.9% increase in nominal total revenue shown in Table 1 above. Adjusting for inflation, FY22 total revenues increased to $16.318 billion in “real” FY00 dollars. This is an inflation adjusted increase of $1.087 billion and a growth rate of 7.1%. Over 22 years this is average annual inflation adjusted revenue growth of 0.32% (roughly 1/3rd of 1%).
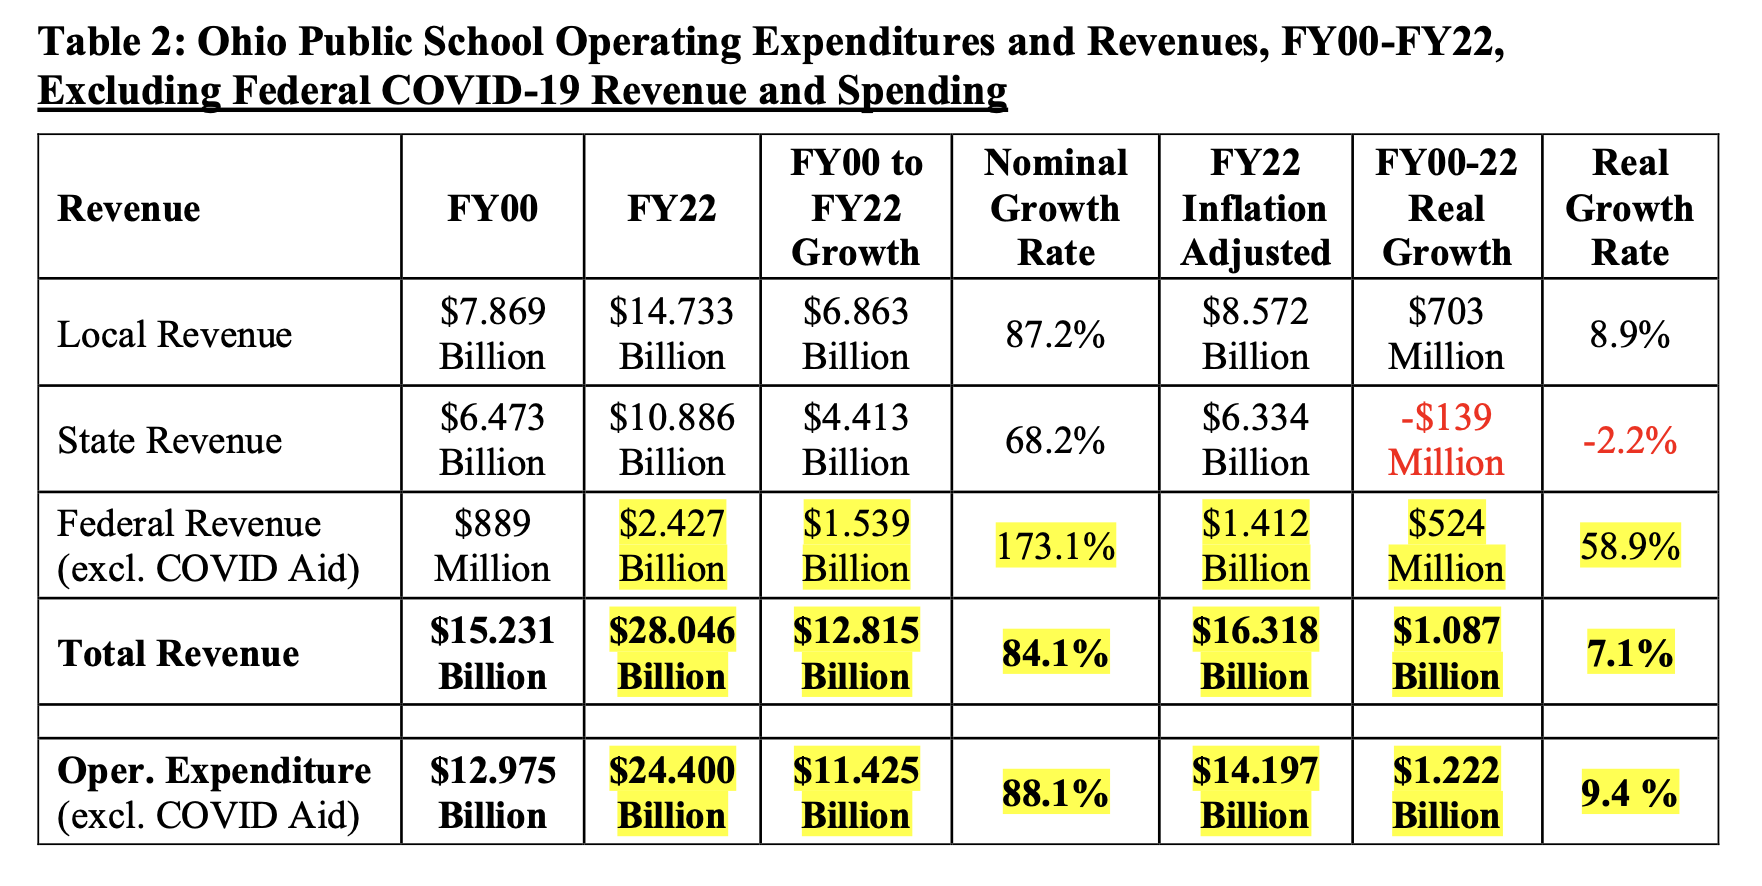
Table 2 also shows that excluding $1.383 billion in COVID spending reduces FY22 Ohio public school operating expenditures to $24.000 billion from the $25.783 billion amount shown in Table 1. This means that total expenditures increased from $12.975 billion in FY00 to $24.400 billion in FY22. This is an increase of $11.425 billion (88.1%) unadjusted for inflation. Adjusting for inflation, FY22 expenditures were $14.197 billion in FY00 “real” dollars. This is an inflation adjusted increase of $1.222 billion and a growth rate of 9.4%. Over 22 years this is average annual inflation adjusted expenditure growth of 0.43% (less than ½ of 1%).
Discussion: Closer Examination of Expenditures and Revenues Over Time
The graph of Ohio public school operating expenditures shown on page 6 of the Auditor’s analysis provides more detailed every-other-year data on K-12 spending throughout the 22-year period that was investigated.
Examination of this data shows that over the 10 years from FY00 to FY10 public school operating spending in Ohio increased from $13.0 billion to $19.8 billion. This is a $6.8 billion (52.3%) increase, unadjusted for inflation. Inflation over this timeframe was 28.4% meaning that K-12 public education spending increased at nearly double the rate of inflation from 2000 to 2010.
However, over the 12 years from FY10 to FY22 public school operating spending in Ohio increased by only $6.0 billion from $19.8 to $25.8 billion, a (30.3%) increase. Inflation over this 12-year period was almost exactly the same at 29.75%. Thus, virtually all of the increase in spending beyond inflation from FY00 to FY22 occurred in the first 10 years of the 22-year period in question, which coincides with the period immediately after the March 1997 Ohio Supreme Court decision in the DeRolph case which ruled the state’s system of K-12 school finance unconstitutional. FY00 was the second year of implementation of the new school funding formula developed John Augenblick, the school funding consultant hired by the state in the aftermath of the DeRolph decision. It was well understood by policymakers during this time period that Ohio’s investment in K-12 public education needed to increase, however, the initial level of increase was not sustained from FY12 onward after the existing funding formula was eliminated in the FY12-13 biennium. The funding formulas that were in place from FY12 through FY21 either froze state aid (FY12, FY13, FY20 and FY21) or were not based on calculations designed to objectively compute adequate levels of funding as required by the DeRolph decision (FY14-FY19).
The year-by-year data provided on page 7 of the auditor’s report is insufficient to do a similar breakdown of revenues from FY00 to FY10 and then from FY10 to FY22. However, OEPI’s August 2018 analysis of Ohio school finance showed that state plus local revenue increased by 53% from FY99 to FY09 but only by 18.2% from FY09 to FY19. This pattern is similar to the expenditure data pattern explained immediately above and is influenced by the same cause – the state’s relatively strong response in the years immediately after the DeRolph ruling.
Additionally, the U.S. Census Bureau annually releases state-by-state data on elementary and secondary school finances. While the FY00 Census Bureau data file does not include state-by-state comparisons, state-by-state data from FY02 and FY22 is available. This data can be found at: https://www.census.gov/programs-surveys/school-finances/data/tables.html
In FY02 Ohio ranked 35th among the 50 states in terms of the percentage of public school operating revenue coming from state sources. In FY02 Ohio provided 44.8% of K-12 education revenue from state sources which 4.6 percentage points below the national average of 49.4%. However, by FY22 Ohio had fallen to 45th among the 50 states, providing 34.2% of K-12 education revenue from state sources, which was 9.5 percentage points below the national average of 43.7%. This finding should not be surprising in light of the data shown in Tables 1 and 2 that total state aid to Ohio school districts did not even keep up with inflation, falling from $6.473 billion in FY00 to $6.334 billion in FY22 inflation-adjusted dollars.
III. Report Findings: Per Pupil Expenditures and Revenues
The Auditor’s school finance analysis also examined Ohio public school revenues and expenditures on a per pupil basis. This is important because it controls for changes in enrollment over time.
The Auditor’s report showed that the number public school students declined by 8.3% (roughly 160,000 students) from 1.84 million in FY00 to 1.68 million in FY22. Preliminary examination of U.S. Census data by OEPI suggests that much of this decrease is likely due to a decline in school age population in Ohio rather than to a mass exodus of students from public schools in Ohio.
In the year 2000 there were 2,133,409 children age 5-17 in Ohio and by 2010 this had fallen to roughly 1,935,000 – a decline of 9.2%. While there are now over 120,000 students attending Ohio community schools, these schools are public schools and these students are included in the figures cited in the Auditor’s report. School voucher options have increased dramatically in Ohio over time, however vouchers have increasingly gone to students already attending private schools. For example, in FY24 96% of new EdChoice Expansion vouchers went to students already attending private schools. The issue of enrollment changes and the reasons behind it certainly can withstand additional analysis, however.
Table 3 below provides a summary of the report’s findings on a per pupil basis. In general, as a result of the decline in enrollment, all of the per pupil expenditure and revenue measures showed larger growth than did the total revenue and expenditure measures discussed in section II above.
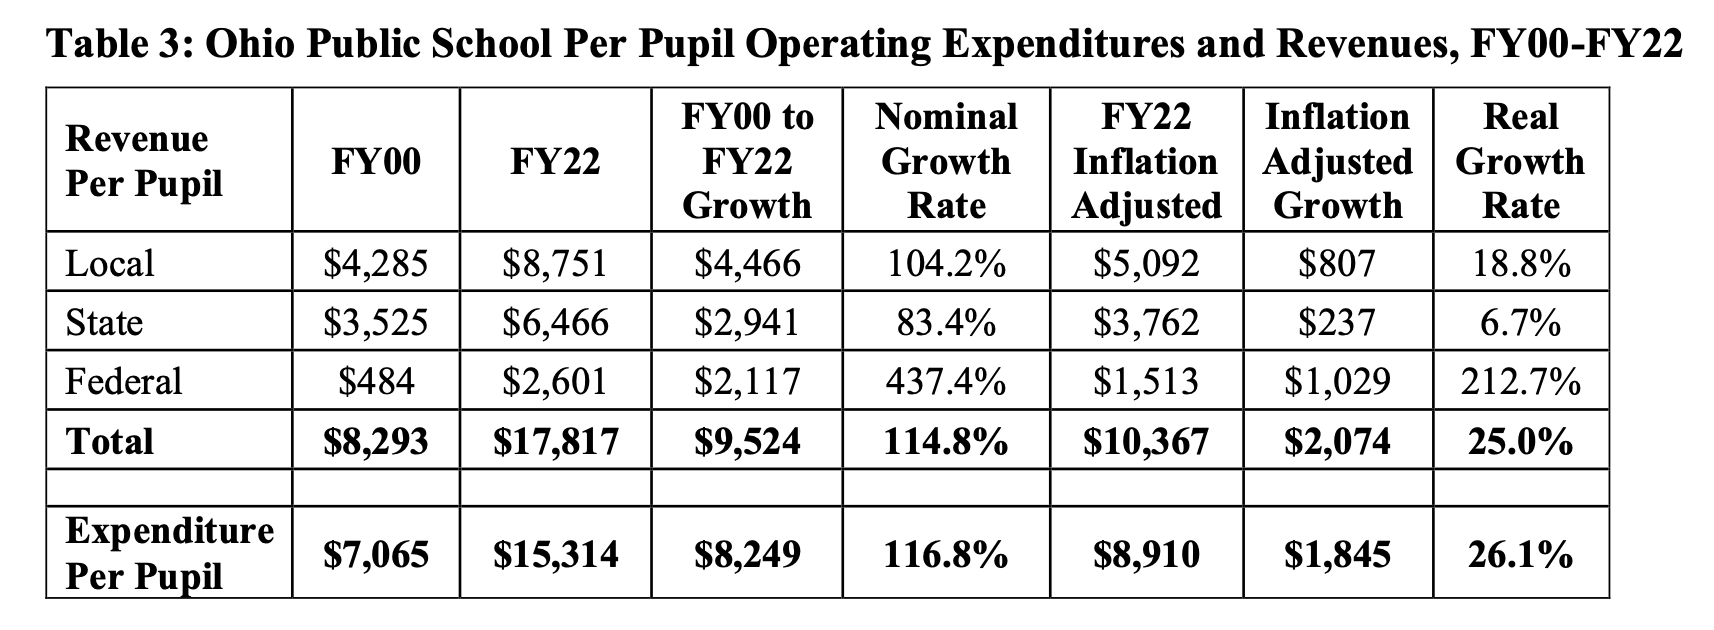
Table 3 shows that local revenues per pupil increased from $4,285 in FY00 to $8,751 in FY22, unadjusted for inflation. This is an increase of $4,466 per pupil (104.2%). However, inflation adjusted local per pupil revenues $5,092 per pupil in FY22, an increase of $807 per pupil (18.8%) in real FY00 dollars. This is an average increase of 0.86% annually above inflation.
Table 3 also shows that state revenue per pupil increased from $3,525 in FY00 to $6,466 in FY22, an increase of $2,941 per pupil (83.4%). However, inflation adjusted state per pupil revenues only increased to $3,762 per pupil in FY22, an increase of only $237 per pupil (6.7%) in real FY00 dollars. This is an average increase of 0.30% annually above inflation.
Additionally, Table 3 shows that total revenues increased from $8,293 per pupil in FY00 to $17,817 per pupil in FY22, unadjusted for inflation. This is an increase of $9,524 (114.8%). However, after adjusting for inflation the FY22 total revenue per pupil figure was only $10,367, an increase of $2,074 (25.0%). This is an average increase of 1.14% per year above inflation.
Similarly, per pupil expenditures increased from $7,065 in FY00 to $15,314 in FY22, unadjusted for inflation. This an increase of $8,249 (116.8%). Once adjusted for inflation FY22 expenditures per pupil were $8,910, an increase of $1,845 pr pupil (26.1%). This is an average increase of 1.19% per year above inflation.
Table 4 below provides a summary of the report’s findings on a per pupil basis excluding COVID-19 revenues and expenditures. As was the case in Table 2 above, the data highlighted in yellow does not include Covid-related spending and revenue.
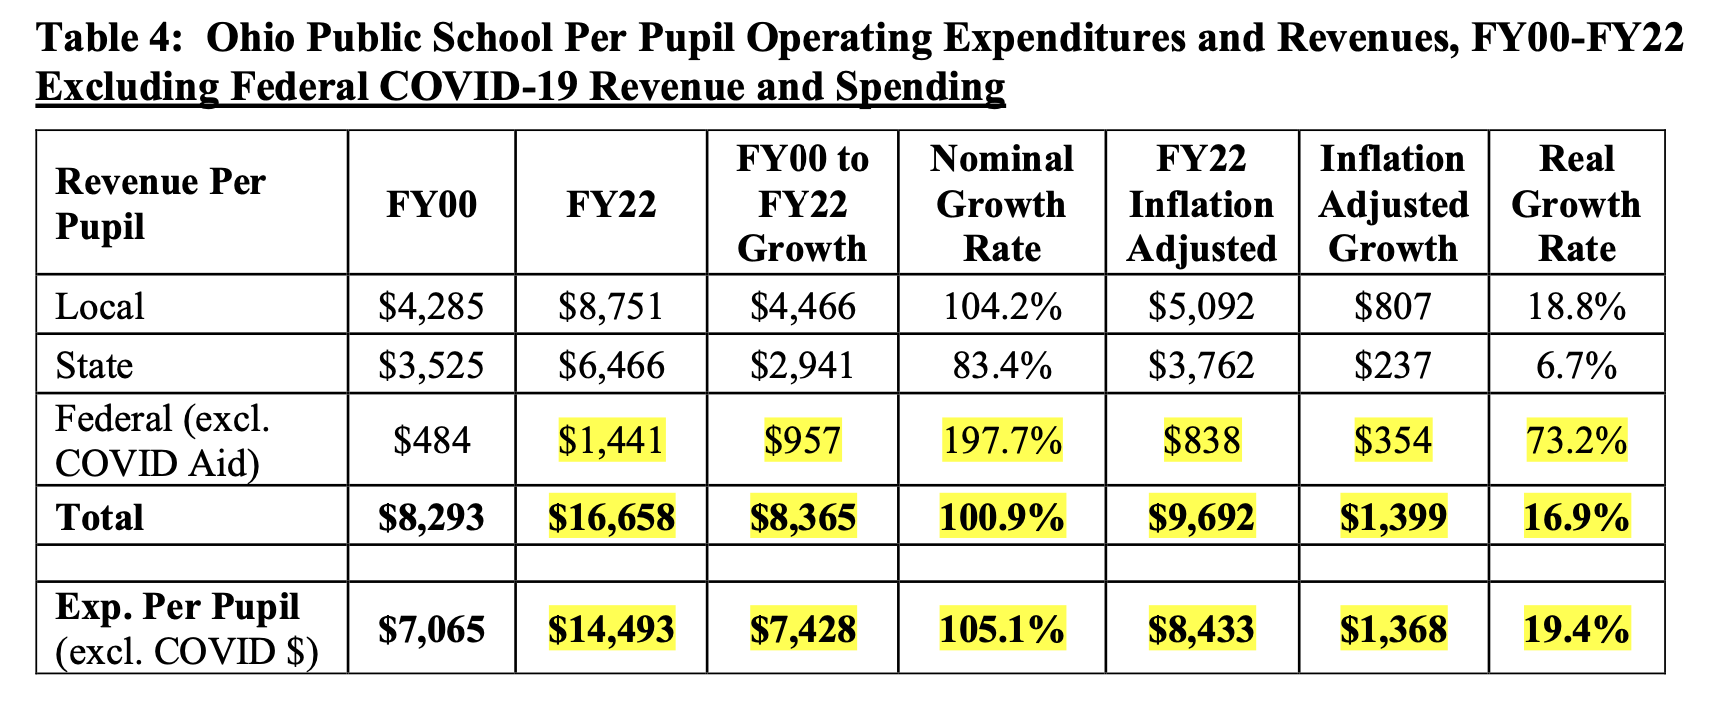
Table 4 shows that when COVID Federal revenues are excluded, Federal revenues per pupil were $1,141 in FY22, $1,160 per pupil lower than the $2,601 per pupil figure shown in Table 3 which includes COVID-related revenue. This translates into an FY22 total revenue per pupil figure of $16,658 in FY22, unadjusted for inflation. This is an increase of $8,365 per pupil (100.9%) from FY00. When inflation is taken into account, COVID-excluded FY22 total revenue per pupil increased by $1,399 (16.9%) to $9,692 in “real” FY00 dollars. This is an average increase of 0.77% per year beyond inflation.
Table 4 shows that excluding the COVID spending, expenditures per pupil were $14,493 per pupil in FY22, unadjusted for inflation. This is a decrease of $821 per pupil from the $15,314 per pupil figure shown in Table 3 which includes the COVID-related spending. When inflation is taken into account, FY22 spending per pupil was $8,433 in real FY00 dollars. This is an inflation adjusted increase in expenditures of $1,368 per pupil (19.4%). This is an average increase of 0.85% per year above inflation.
Because the COVID funding is a) temporary; b) limited in its usage; and c) in response to a once-in-a-hundred-years worldwide pandemic, excluding these funds from both the revenue and expenditure totals in FY22 is completely appropriate.
Additional Consideration: Changes in Pupil Needs Over Time
While it is clear that Ohio public school enrollment has declined significantly since FY2000, it is less understood how the mix of pupils has changed over that period of time. Even as the total number of public school students has fallen, Ohio has seen a significant increase in both the number and percentage of higher cost pupils including students with disabilities, economically disadvantaged pupils, and English learners.
In FY01 the percentage of economically disadvantaged students in Ohio was 27.0%. By FY22 this percentage had increased to 46.6%. In FY00 there were roughly 476,000 economically disadvantaged pupils and in FY22 there were roughly 653,000.
Similarly, in FY00 the percentage of students with disabilities was 9.0% and by FY22 it had increased to 15.7%. In raw numbers there were 158,700 students with disabilities in FY00 and 230,000 in FY22.
The DEW Fiscal Benchmark Report uses this data, along with data on English learners, to compute a measure known as the “Expenditure Per Equivalent Pupil” (EPEP). The EPEP is computed by weighting higher cost students and then dividing total expenditures in each school district by the weighted number of pupils[1]. By adjusting for the number of higher cost pupils in each school district the EPEP essentially adjusts for the “degree of difficulty” each district faces in educating its pupil population. The basis for this adjustment is that the same level of expenditure will not go as far in a district with more high-cost pupils than it does a district with fewer high-cost pupils. In this manner the EPEP provides an “apples to apples” comparison of expenditure levels across Ohio’s different school districts by showing the average amount per pupil available to spend on typical students after the needs of higher cost students have been accounted for.
The EPEP notion can also be used to compare expenditure levels across time, however. By OEPI’s calculation, the statewide average weighted student percentage in FY00 was 9.35%. This means that Ohio’s mix of higher-cost students added an additional average cost 9.35% beyond the cost of educating a “typical” student in FY00.[2] By FY22 the statewide average weighted pupil cost had increased to 26.17%. This means that dollars spent on K-12 education in FY22 – even after they have been adjusted for inflation – do not go as far as in FY00 because there are significantly more high-cost students in FY22 than in FY00.
The figures in the above paragraph can be used to compute a statewide average Expenditure Per Equivalent Pupil in both FY00 and FY22. This is done by taking the FY00 expenditure per pupil of $7,065 and dividing by the additional cost of 1.0935 (9.35%) and then taking the FY22 inflation adjustment (with COVID spending excluded) average expenditure per pupil of $8,433 and dividing by the FY22 weight of 1.2617 (26.17%). These calculations are shown below.
FY00 Expenditure per equivalent pupil = $7,065 / 1.0935 = $6,461.
FY22 Expenditure per equivalent pupil = $8,436 / 1.2617 = $6,684.
The figures above indicate that after adjusting for both inflation and the larger share of high-cost students, the FY22 statewide average EPEP of $6,684 is only 3.5% larger than the FY00 statewide average EPEP figure of $6,461. This is an average increase of only 0.16% annually over the 22-year timeframe of the Auditor’s analysis.
[1] – The expenditure per equivalent pupil measure is computed by using the special education weights for students with disabilities, the Category 1 special ed. weight is used for English learners, and a flat weight of 0.1 (additional 10% cost) is used for economically disadvantaged students.
[2] – Note the FY00 funding formula did not include additional funding for English learners so they are not included in this computation.
IV. Summary of Findings
OEPI’s review of the Ohio State Auditor’s longitudinal school finance study reaches the following conclusions.
1) The report is written in a factual and objective manner and the study is based on sound methodology and data. While the report lacks crucial context in some areas the findings themselves are legitimate.
2) Adjusting for inflation and excluding COVID-19 spending, expenditures increased by $1.222 billion (9.4%) over 22 years. This is an inflation adjusted average of $55.5 million per year (0.43% annually).
3) Adjusting for inflation and excluding COVID-19 aid, total revenues increased by $1.087 billion (7.1%) over 22 years. This is an inflation adjusted average of $49.4 million per year (0.32% annually).
4) Adjusting for inflation and excluding COVID-19 aid, local revenues increased by $703 million (8.9%) over 22 years. This is an inflation adjusted average of $32.0 million per year (0.40% annually).
5) Adjusting for inflation and excluding COVID-19 aid, state revenues decreased by -$139 million (-2.2%) over 22 years. This is an inflation adjusted average of -$6.5 million per year
(-0.10% annually). This finding corresponds with U.S Census Bureau data which shows that Ohio’s ranking on the share of K-12 education revenue derived from state sources has fallen from 35th to 45th from 2002 to 2022.
6) Adjusting for inflation and excluding COVID-19 spending, expenditures per pupil increased by $1,368 per pupil (19.4%) over 22 years. This is an inflation adjusted average of $62 per pupil per year (0.88% annually).
7) Adjusting for inflation and excluding COVID-19 aid, total revenues per pupil increased by $1,399 per pupil (16.9%) over 22 years. This is an inflation adjusted average of $64 per pupil per year (0.77% annually).
8) Overall, total revenues and expenditures, both in total and on a per pupil basis, have increased by less than 1% annually beyond inflation over the 22-year timeframe of this study. By any objective yardstick such increases are modest.
9) The expenditure increases are largely concentrated in the first half of the study’s timeframe (FY00-FY10) where total expenditures increased at nearly double the rate of inflation. This period coincides with the timeframe when state policymakers were making concerted efforts to increase K-12 education funding the aftermath of the Ohio Supreme Court’s DeRolph ruling. Expenditure increases from FY10-FY22 were roughly equivalent to the rate of inflation.
10) Initial examination of U.S. Census data suggests that the 8.3% decline in public school enrollment from FY00 to FY22 coincides with a significant decrease in the number of school age children in Ohio. More research on this topic is recommended.
11) Even while the total number of public school students has been declining, the number and percentage of high cost students served by Ohio public schools has increased significantly.