
The Ohio Department of Education and Workforce (ODEW) annually publishes the District Profile Report, commonly known as the “Cupp Report”. The Cupp Report can found online at: https://education.ohio.gov/Topics/Finance-and-Funding/School-Payment-Reports/District-Profile-Reports/FY2024-District-Profile-Report.
The Cupp Report provides a wide assortment of school district data including data on student demographics, school and district personnel and financial data including property taxes, expenditures, and revenues by source. The ODEW website shows Cupp Report data from FY10 through FY24, however Dr. Howard Fleeter also has Cupp Report data from FY06 through FY09 which is no longer available online.
There are 4 data elements on the Cupp Report which pertain to administrators. These are:
- FTE # of Administrators
- Pupil to Administrator ratio
- Administrators’ Average Salary
- Administrator Expenditure per Pupil
The Cupp Report webpage also explains that administrators are defined as persons in the following job positions:
- Administrative Assistants
- Assistant Principal
- Coordinator
- Deputy Superintendent
- Director
- Education Administration Specialist
- School Principal
- Superintendent
- Supervisor/Manager
- Treasurer
- Other Officials/Administrators
- Community School Administrator (presumably pertinent only in Community schools)
Cupp Report data is available for each school district and at the statewide level (data is also available for comparison districts to each school district based on ODEW rubrics for determining “similar” school districts). The purpose of this memo is to examine the statewide Cupp Report data on school and district administrators from FY06 through FY24.
Table 1 provides a comparison from FY06 through FY24 between the change in the statewide average administrator salary and the CPI-U, the most commonly used measure of inflation[1]. Table 1 shows that the statewide average administrator salary increased by 32.5% from FY06 to FY24 while inflation as measured by the CPI-U increased by 55.6% over that time frame.
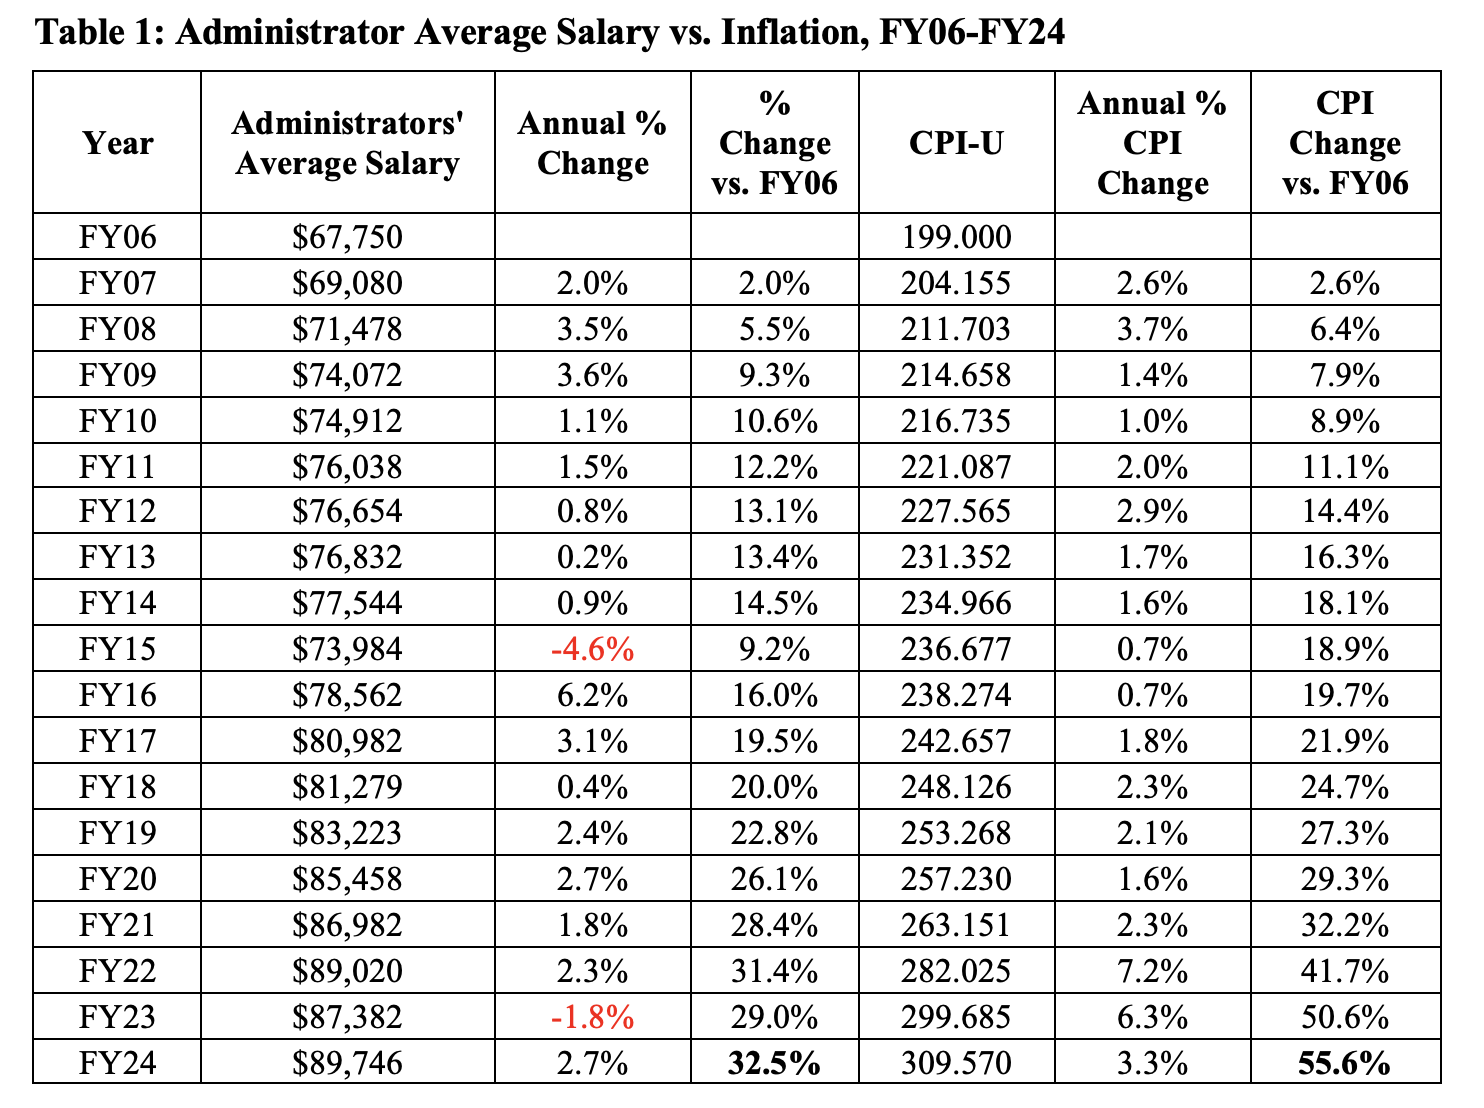
Table 2 shows the statewide average FTE number of administrators from FY06 to FY24 as well as the Pupil to Administrator ratio over the same timeframe.
Table 2 shows that statewide average FTE number of administrators generally declined from FY06 to FY13 and then has increased in all but 2 years since FY13. Over the entire FY06 to FY24 period the statewide average FTE number of administrators has increased by 14.1% from FY06 (18.71 FTE administrators) to FY24 (21.35 FTE administrators). This is an increase of 2.64 administrators over the 18-year timeframe.
It is important to note that seemingly ever-increasing requirements and responsibilities for public schools are certainly a key factor in the recent increase in the number of administrators. Safety and security requirements, expanding technology and cybersecurity demands, rapid expansion in the need for behavioral health and other student services and significant increases in the needs surrounding screening and intervention services for students with disabilities are all examples of areas where public schools have experienced greater responsibilities in recent years. It should come as no surprise that meeting these myriad additional needs would require a modest increase in administrative staff.
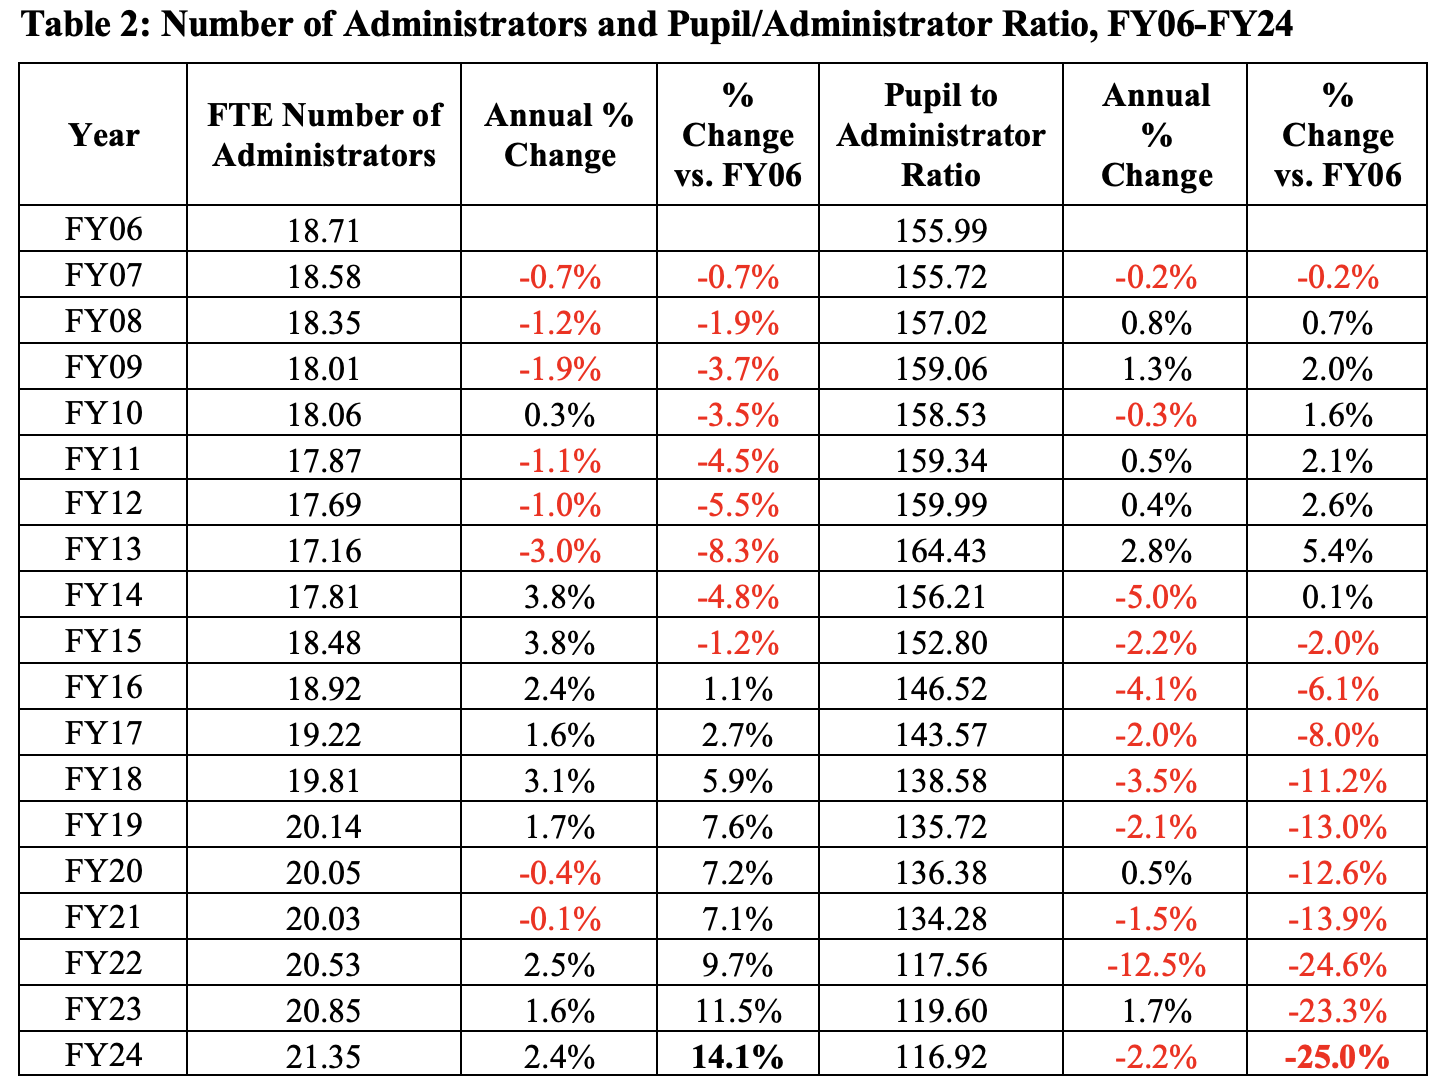
Table 2 also shows that statewide average pupil to administrator ratio generally increased from FY06 to FY13 and then has decreased in all but 1 year since FY13. The decrease in the average number of pupils per administrator can be traced both to the relatively modest increase in the number of administrators since FY13 but more so to the decline in traditional district enrollment from FY13 to FY24. In FY13 year-end enrollment was 1,591,774 but by FY24 enrollment had declined to 1,439,473.
While some of the decrease in enrollment can be attributed to students opting for community school and private school vouchers, the majority of the decrease is due to demographic changes which have led to a general decline in the number of school-age children in Ohio over the last 20 years. To those who might argue that the number of administrators should decline as enrollment declines, it is imperative to note that many administrative positions are essentially a fixed cost. Each district needs a superintendent, treasurer, gifted coordinator, EMIS coordinator, transportation coordinator and other such positions regardless of the number of students in the district. Similarly, buildings all need principals and a modest decline in enrollment cannot be matched by a reduction to less than 1 FTE principal.
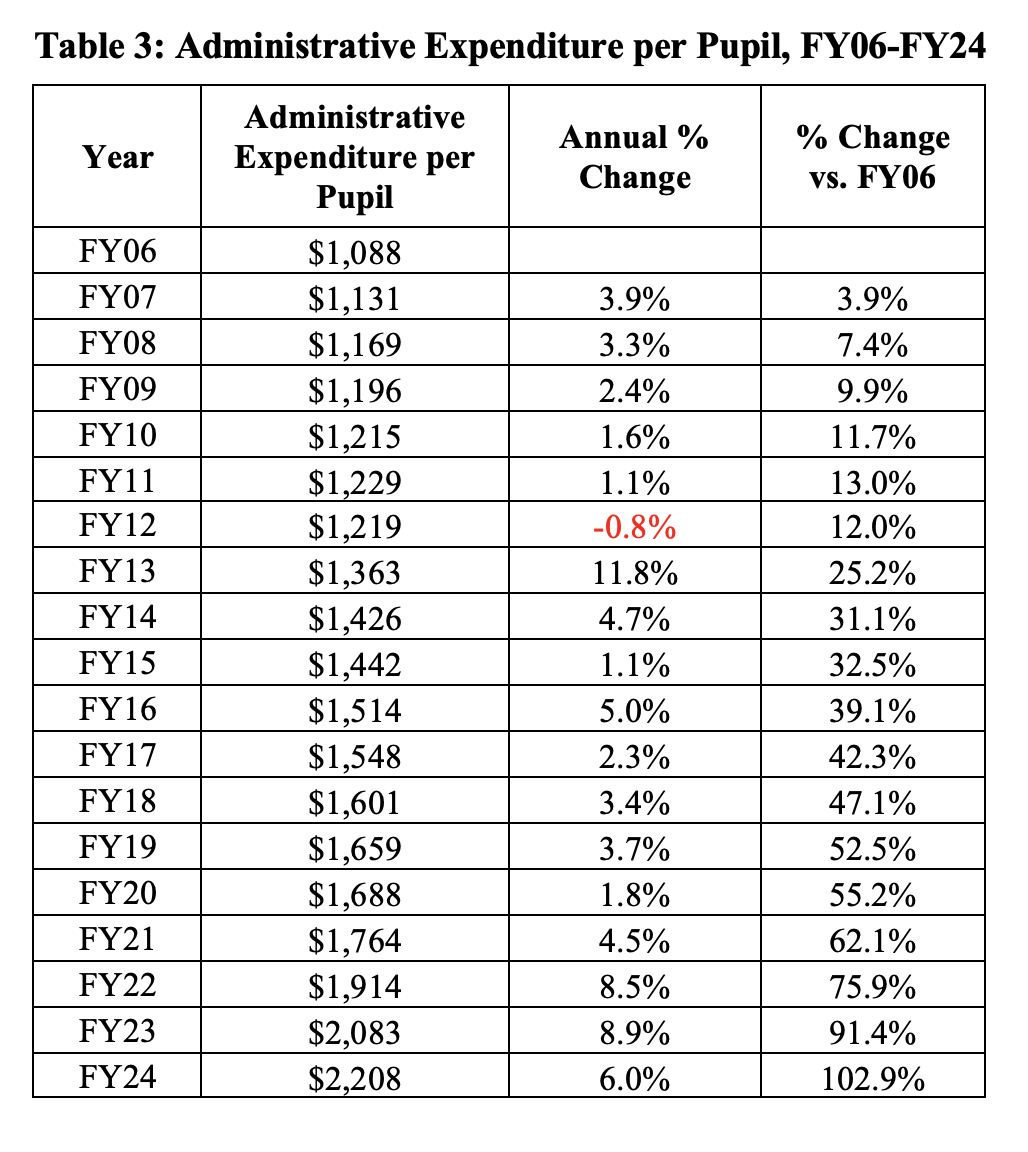
The final administrator related data element on the Cupp report is administrative expenditure per pupil. Table 3 shows the statewide average administrative expenditure per pupil from FY06 to FY24. The statewide average administrative expenditure per pupil has roughly doubled from FY06 to FY24. While this may appear to some as a sign of bureaucratic bloat and inefficiency, this increase is more properly understood as a combination of 3 factors; the modest increase in administrators resulting from expanding school responsibilities; the decline in enrollment which has been driven by demographic changes; and the fixed cost nature of many administrative positions. It is important to note that an increase in administrative expenditures per pupil is not the same as an increase in administrative expenditures in total dollars. From that standpoint, it is worth remembering that Table 1 showed that the increase in administrator salaries from FY06 to FY24 was just over half the rate of inflation over that timeframe.
[1] The CPI-U is the Consumer Price Index for all urban consumers.