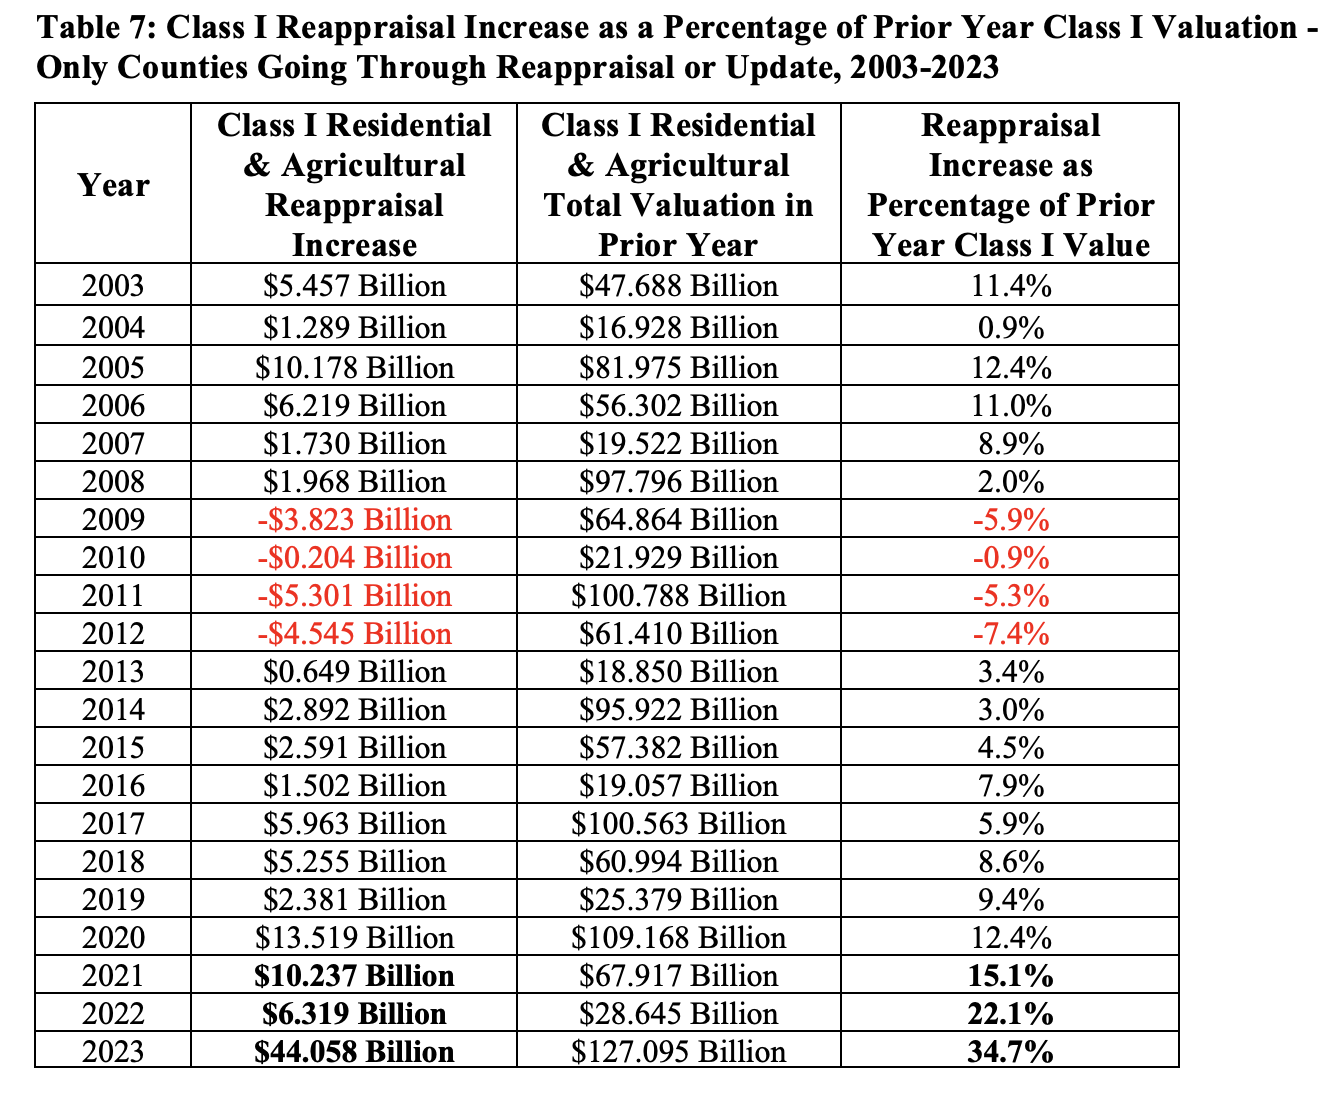
Overview: Recent reappraisal increases are far outside historical norms. The 2023 reappraisal and update increase was 7.3 times as large as the prior reappraisal and update increase for the same counties in 2017, while the 2022 reappraisal increase was 4.0 times as large as the increase in 2016 and the 2021 increase was 3.8 times as large as the increase in 2015. Also, indications from county auditors are that the reappraisal increases in 2024 will be comparable to (and possibly larger than) those in 2023. However, the data shown here clearly indicates that these recent large increases in housing values are best viewed as a historically anomalous short-term issue.
Part I: 2005, 2008, 2011, 2014, 2017, 2020 & 2023 Reappraisal and Update Analysis
Tables 1 and 2 below provide some insight on patterns of reappraisal increases from 2005 through 2023. The seven years shown in the table are all property reappraisal or statistical update years for the same group of 41 counties. These 41 counties are listed below.
2023 Reappraisal Counties (N=28)
Auglaize, Clinton, Darke, Defiance, Delaware, Franklin, Gallia, Geauga, Hamilton, Hardin, Harrison, Henry, Jackson, Licking, Mahoning, Mercer, Morrow, Perry, Pickaway, Pike, Preble, Putnam, Richland, Seneca, Shelby, Trumbull, Van Wert, Wood
2023 Update Counties (N=13)
Ashland, Ashtabula, Athens, Butler, Clermont, Fulton, Greene, Knox, Madison, Montgomery, Noble, Summit, Wayne
Note that the list above is exactly the same for the years 2005, 2011 and 2017. And in 2008, 2014 and 2020 the counites undergoing reappraisal in 2023 experienced the statistical update while the counties undergoing the update went through full reappraisal.
Table 1 compares the total reappraisal and update increases in Class I residential and agricultural real property value with the total increase in Class I property value from the preceding year (the other primary factor in valuation increases from one year to the next is new construction).
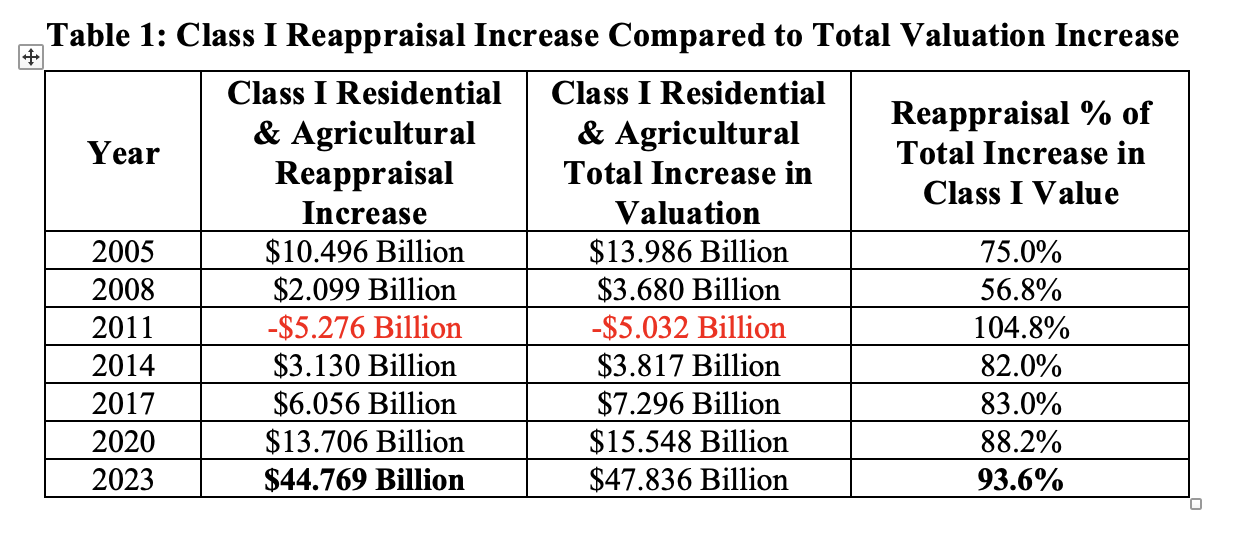
The data in Table 1 clearly shows how unusual a year 2023 was in terms of reappraisal increases. Class I reappraisal and update increases totaled $44.769 billion in 2023. This is 93.6% of the total increase in Class I value from FY22. Three years earlier in 2020, reappraisal increases were only $13.706 billion and were 88% of the total Class I valuation increase. In 2008 reappraisal increases were $2.099 billion and were responsible for only 57% of the total $3.680 increase in Class I value. Note that the negative change in valuation in 2011 reflects the impact of the housing market decline brought on by the 2008-09 recession.
Table 2 provides a second perspective on reappraisal increases. Table 2 shows Class I reappraisal increases and compares to the prior year Class I valuation figure to compute a percentage increase in valuation due to reappraisal. Note that the data in Table 2 is only for counties undergoing reappraisal and update in each of the seven years included in the table.
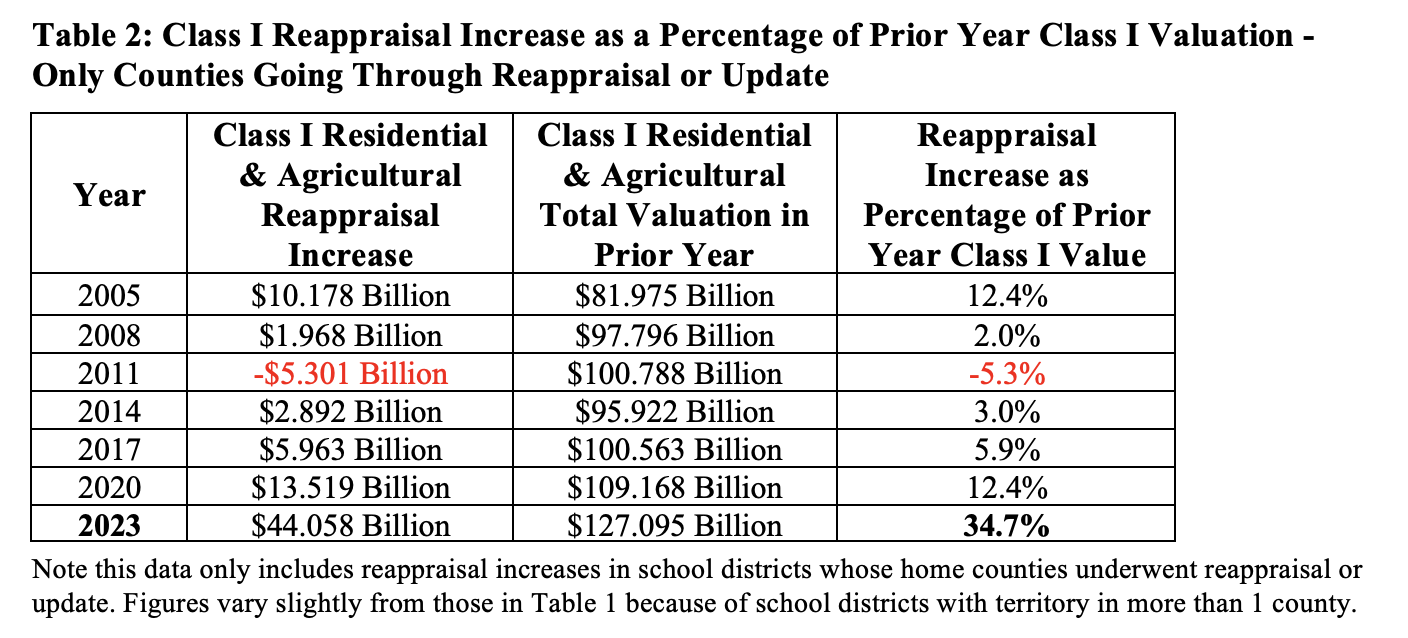
Table 2 clearly shows that the 34.7% average increase in reappraisal value in 2023 is far higher than that in any of the other years in which these counties underwent reappraisal or statistical update. This again reinforces the extent to which 2023 was an outlier in terms of Class I property reappraisal increases.
Part II: 2004, 2007, 2010, 2013, 2016, 2019 & 2022 Reappraisal and Update Analysis
Tables 3 and 4 below provide some insight on patterns of reappraisal increases from 2004 through 2022. The seven years shown in the table are all property reappraisal or statistical update years for the same group of 23 counties. These 23 counties are listed below.
2022 Reappraisal Counties (N=12)
Adams, Columbiana, Hancock, Hocking, Holmes, Lawrence, Meigs, Monroe, Paulding, Scioto, Tuscarawas, Washington
2022 Update Counties (N=11)
Carroll, Champaign, Clark, Fairfield, Logan, Marion, Medina, Miami, Ross, Union, Wyandot
Table 3 compares the total reappraisal and update increases in Class I residential and agricultural real property value with the total increase in Class I property value from the preceding year (the other primary factor in valuation increases from one year to the next is new construction).
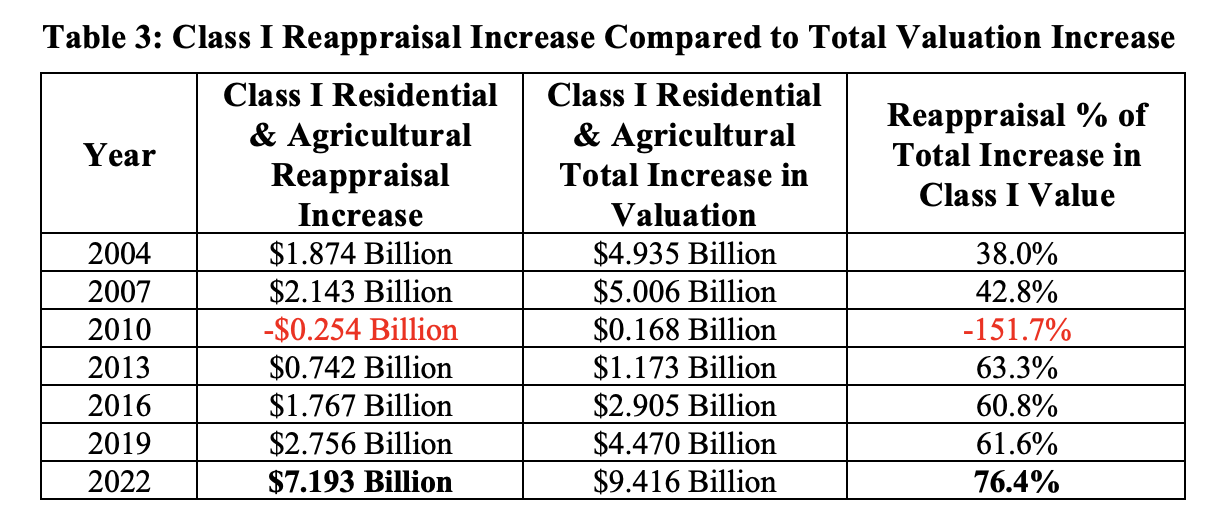
As was the case in Table 1, the data in Table 3 clearly show that 2022 was also an unusual year in terms of reappraisal increases. Class I reappraisal and update increases totaled $7.193 billion in 2022. This is 76.4% of the total increase in Class I value from 2021. Three years earlier in 2019, reappraisal increases were only $2.756 billion and were 61.6% of the total Class I valuation increase. The reappraisal and update increases in the other five years shown in Table 3 were all less than the 2019 figure. Note that the negative change in valuation in 2010 reflects the impact of the housing market decline brought on by the 2008-09 recession.
Table 4 provides a second perspective on reappraisal increases just as Table 2 above did. Table 4 shows Class I reappraisal increases and compares to the prior year Class I valuation figure to compute a percentage increase in valuation due to reappraisal. Note that the data in Table 4 is only for counties undergoing reappraisal and update in each of the seven years included in the table.
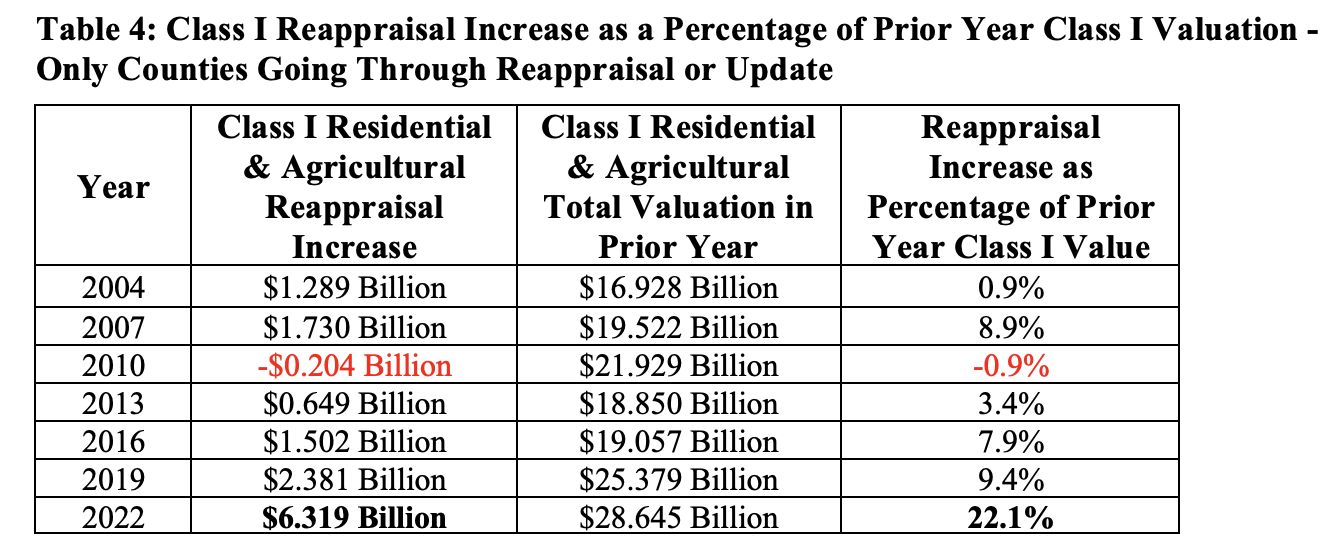
* Again, this data only includes reappraisal increases in school districts whose home counties underwent reappraisal or update. Figures vary slightly from those in Table 3 because of school districts with territory in more than 1 county.
As was the case in Table 2, Table 4 clearly shows that the 22.1% average increase in reappraisal value in 2022 is far higher than that in any of the other years in which these counties underwent reappraisal or statistical update. This again reinforces the extent to which 2022 was an outlier in terms of Class I property reappraisal increases.
Part III: 2003, 2006, 2009, 2012, 2015, 2018 & 2021 Reappraisal and Update Analysis
Tables 5 and 6 below provide some insight on patterns of reappraisal increases from 2003 through 2021. The seven years shown in the table are all property reappraisal or statistical update years for the same group of 24 counties. These 24 counties are listed below.
2021 Reappraisal Counties (N=5)
Allen, Coshocton, Guernsey, Sandusky, Vinton
2021 Update Counties (N=19)
Belmont, Brown, Crawford, Cuyahoga, Erie, Fayette, Highland, Huron, Jefferson, Lake, Lorain, Lucas, Morgan, Muskingum, Ottawa, Portage, Stark, Warren, Williams
Table 5 compares the total reappraisal and update increases in Class I residential and agricultural real property value with the total increase in Class I property value from the preceding year (the other primary factor in valuation increases from one year to the next is new construction).
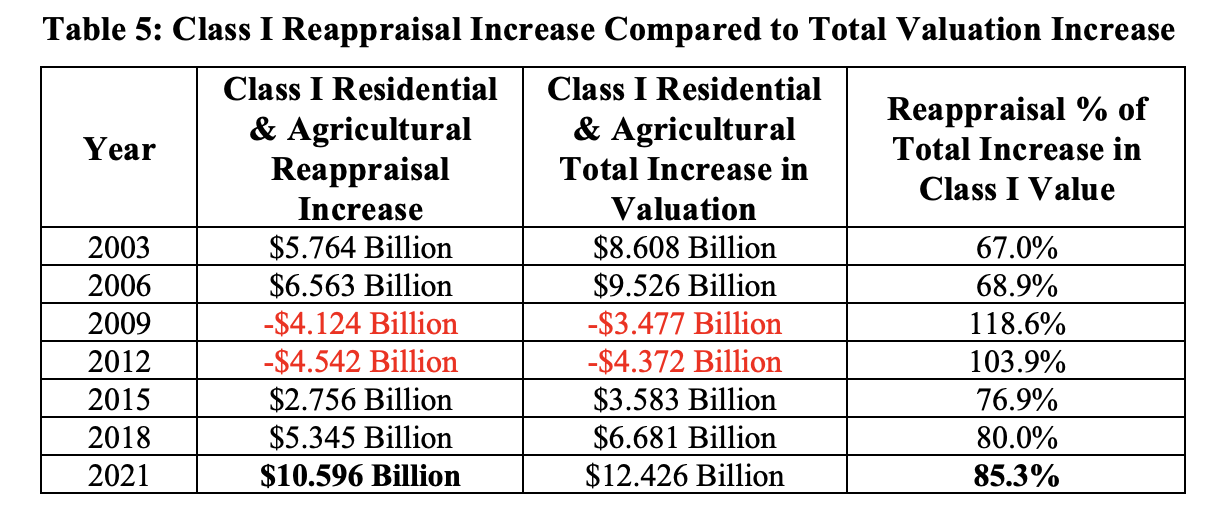
As was the case in Tables 1 and 3, the data in Table 5 clearly show that 2021 was also an unusual year in terms of reappraisal increases. Class I reappraisal and update increases totaled $10.596 billion in 2021. This is amount is 61% larger than the next highest reappraisal increase (2006) and 85.3% of the total increase in Class I value from 2020. Three years earlier in 2018, reappraisal increases were only $5.345 billion and were 80.0% of the total Class I valuation increase. Furthermore, information released this summer by county auditors in counties undergoing reappraisal and update in 2024 indicates that the reappraisal increases this year will be even larger than those in 2021. Finally, the negative changes in valuation in both 2009 and 2012 reflect the impact of the housing market decline brought on by the 2008-09 recession.
Table 6 provides a second perspective on reappraisal increases just as Tables 2 and 4 above did. Table 6 shows Class I reappraisal increases and compares to the prior year Class I valuation figure to compute a percentage increase in valuation due to reappraisal. Note that the data in Table 6 is only for counties undergoing reappraisal and update in each of the seven years included in the table.
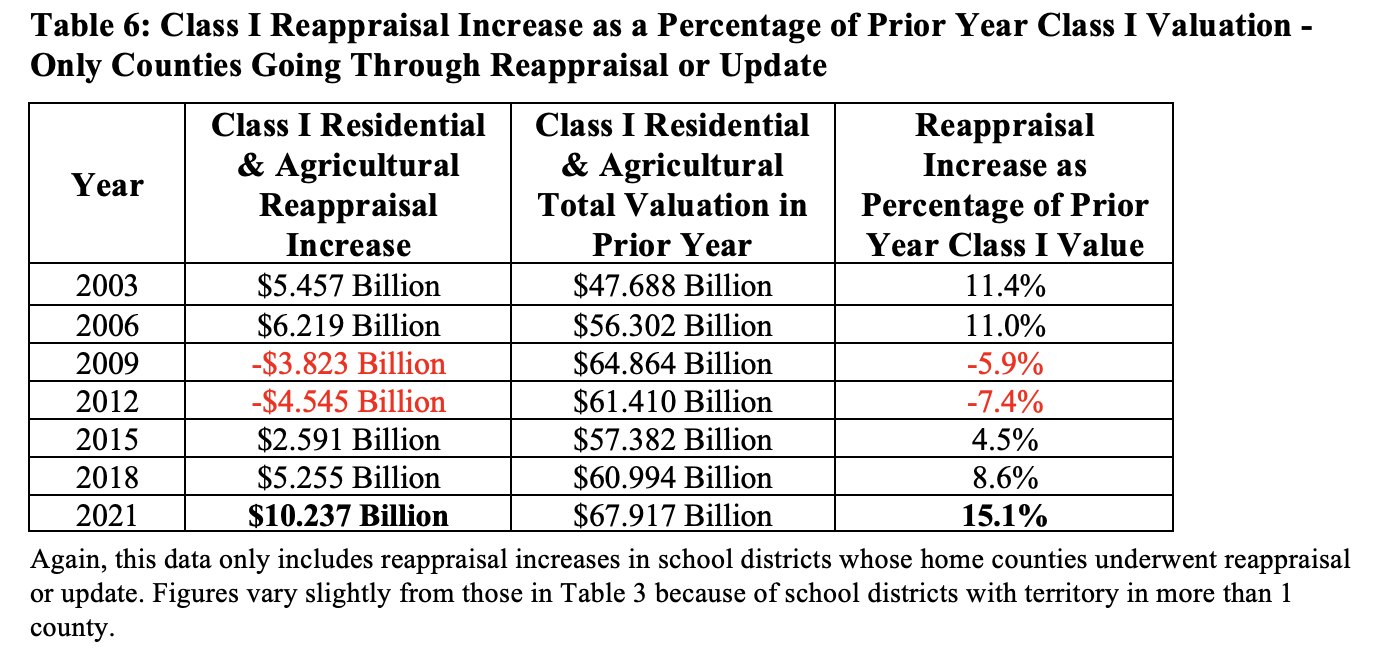
As was the case in Tables 2 and 4, Table 6 shows that the 15.1% average increase in reappraisal value in 2021 is higher than that in any of the other years in which these counties underwent reappraisal or statistical update. This again reinforces the extent to which 2021 marks the beginning of the recent period characterized by historically large Class I property reappraisal increases. And again, data released recently by county auditors in counties undergoing reappraisal and update indicates that the 2024 reappraisal increase will be even larger than those in 2024.
Table 7 combines the data shown in Tables 2, 4 and 6 and provides a summary of reappraisal increases over the 21-year period from 2003 through 2023. Table 7 shows that while the average percentage of reappraisal increase has been increasing since 2017, it is only since 2022 that the average percentage increase has been far outside historical norms over the past 21 years.